Successful Process Characterization – A How-to-Guide in 7 steps

Process validation (PV) aims at reassuring a manufacturer of constant product quality. Moreover, it is a regulatory requirement to achieve licensure of a pharmaceutical product Failing to efficiently plan and execute activities here leads to increased time-to-market. Statistics play a pivotal role here, as is shown by the fact that in the 22 pages of the latest FDA guidance document on process validation, statistical approaches and the need of statisticians in a multi-disciplinary team is mentioned no less but 15 times. This underscores the importance of showing statistical confidence about the chosen control strategy for critical process parameters (CPPs), input material, and measured CQAs during the manufacturing process.
The typical goal of a Process Characterization Strategy is to identify process parameters that impact on product quality and yield by
- Identifying interactions between process parameters and critical quality attributes
- Justifying and if necessary adjusting manufacturing operating ranges and acceptance criteria
- Ensuring that the process delivers a product with reproducible yields and purity
- Heads up detection of manufacturing deviations using the established control strategy and knowledge about impact of process inputs on product quality
Following acceptance criteria can formulated for a successful PC. In a first step the scope, deliverables and timelines is well aligned between all stakeholders. Evidence based decision making is increased and influence of the loudest voice during risk assessments is reduced. Due to purposeful experimental planning, the impact of PPs onto CQAs is identified at minimal experimental effort. In accordance with QbD principles, a model-based control strategy (e.g. PAR) is established for each unit operation. Since biopharmaceutical manufacturing processes consist of multiple and mutually interacting process steps, a holistic control strategy is required to model realistic overall process behaviour. This is achieved using integrated process modelling. Achieving all this success criteria guarantees that the manufacturing process is well understood, robustness of the process has been shown and consistently delivers highest product quality in drug substance (DS) in the future.
In order to achieve this acceptance criteria a smooth integration of following tasks is required:
- Write a process validation master plan (PVM)
- Conduct a risk assessment (FMEA) and use data science methods to incorporate prior knowledge
- In parallel to FMEA it is possible to start investigating impurity clearance and start scale down model qualification to be ready for experiments
- Perform scale down model (SDM) qualification to detect offsets between scales
- Plan and conduct efficient experiments to identify impact of process parameters (PPs) on critical quality attributes (CQAs)
- Model Based definition of a control strategy (e.g. PAR) for individual unit operations
- Results of purposefully planned experiments can be used to construct overall, integrated process models and set up optimal control strategies (PARs and design space, if applicable) with least possible restriction for manufacturing
1 Process Validation Master Plan (PVM)
Process validation relies on a plan that outlines all steps and goals. Data collection and evaluation need to be aligned even more if the project lasts for one year or more and involves many stakeholders and experimental planning. Usually a process validation master plan is set up, including timelines, data flows, interfaces to departments/stakeholders and deliverables. By that, timely delivery of the final PCS report can be ensured and can be included it into BLA filing. The main parts of a process validation master plan:
- Definition of detailed steps and their input/output structure within a PCS.
- Outlining of tasks that can be performed in parallel, and tasks which are blocked by others.
- Explanation of which partner performs what task (CRO/CMO/Outsourcing).
- Definition of partners’ required deliverables at each stage.
Get support in the development of requirements for each tasks and herein delivers a detailed timeline that ensures timely delivery of regulatory documents and finish process characterization studies.
Success factor: Definition of lean responsibilities and timelines for all stakeholders.
2 Risk Assessment (FMEA)
This most subjective part during a PCS is mainly driven by individual opinions and views on potential failure modes and process impacting factors. Potential impacting factors for further experimental investigation should be selected while other factors are labelled as not critical. RAs are conducted during in-person meetings, often dominated more by gut feelings than on data based evidence. As a result, the outcome of an FMEA depends heavily on which individuals are rating the risk.
RAs will always mainly contain process experts’ subjective look into the future. We balance this bias by incorporating data based prior information of occurrences and severities to reduce the impact of individual opinions on the final FMEA outcome.
Specifically, the following challenges are commonly faced during RA:
- Get rid of the flaws and pitfalls via conducting RAs, e.g. using simple risk priority numbers (RPN) and reduce the impact of the “loudest voice” in the room.
- Leverage historical manufacturing to identify occurrence probabilities.
Success factor: Reduction of subjectivity throughout risk assessments and enabling evidence based decision making on potential risks.
3 Impurity Clearance Analysis
An important question during a PCS is if it’s necessary to investigate all CQAs at each intermediate step in the manufacturing process. We deny that as it is much more important to focus on the important unit operations that ensure reaching the quality target product profile (QTPP) for each CQA. This minimizes the experimental and analytical effort by answering pivotal questions:
- Which CQA should serve as a response variable at which unit operation?
- Where is a good spot to perform spiking studies?
- What are intermediate acceptance criteria?
This analysis can be aided by parallel coordinate plot analysis as shown here in full detail. For unit operations that may have less impact on specific CQAs a reduced experimental effort is performed.
Success factor: Focus on critical unit operations that ensure meeting QTPP.
4 SDM Qualification
It is necessary to establish Scale down models (SDM) representative to the manufacturing scale (ICH Q8). Good industry standards need to be applied here so that scale independent factors remain constant between the scales. Equivalence testing with a two-one-sided t-test (TOST) is the usual statistical method of choice here. Although offsets between scales at target conditions can be detected using those statistical methods, they do not allow to infer if a scale down model is predictable at other process parameter settings for the large scale. Read article "WHAT IS A (QUALIFIED) BIOPROCESS SCALE DOWN MODEL?" fo further details.
Success factor: Identify and characterize potential offsets between manufacturing scale and small scale which is used for further experimental assessment of impact of PPs on CQAs.
5 Experimental Design and Evaluation
By failing to prepare you are preparing to fail
Benjamin Franklin
So planning experiments needs a high investment of time and energy – it is crucial for efficiently generating knowledge.
Experimental criticality assessment is a central point in PCS studies to understand how PPs impact CQAs. This makes them extremely relevant for setting the right control strategy.
There is an abundance of successful applications of statistical design of experiments (DoE) in many industry fields, including pharmaceutical process development. Still, concerns like the following are voiced:
- What is the advantage of DoEs compared to factor at a time (OFAT) experiments?
- What leads to a maximum of information with a minimum number of experiments?
One major advantage of DoEs vs. OFAT experimental plans is to investigate interaction effects between parameters. Those interaction effects are likely to detect in complex biopharmaceutical production processes, e.g. fermentation processes and chromatography steps. For example, physiological responses on combined deflection of process parameters can be expected.
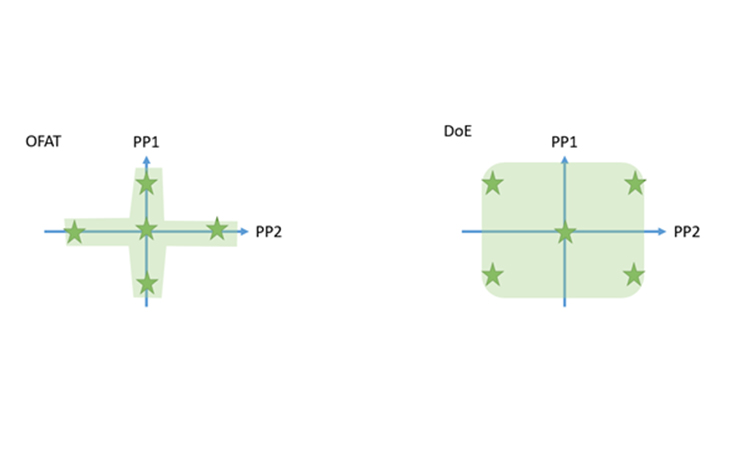
Beside the fact that DoEs are able to resolve interaction effects, DoEs are more statistically powerful than OFAT experiments with less number of runs. As shown in Figure 1 they cover a much large space in your screening space and increase your process knowledge by conducting the same number of planned experiments. This can be visualized by looking at the screening space you cover when conducting an OFAT vs. a DoE:

Figure 1: Organization of 5 runs within a OFAT series (left) and a DoE (right)
To avoid experiments that are not able to detect a relevant effect, an a-priori power analysis should be done for OFATs and DoEs. The statistical power equals the chance of detecting an effect under the given setting (signal noise ratio, number and setting of experiments). In other word, the statistical power reflects the chances to really increase the knowledge from your experiments. Common statistical thresholds are around 80% power for an alpha-level of 5%.
A setting using 5 process parameters that need to be investigated demonstrates that the number of runs required is even lower for an efficient DoE while at the same time it will result in higher power values for the main effects and quadratic effects. For example, performing a DoE for 5 factors (e.g. definitive screening design leads to n=13) gives you a chance of more than 80% to detect the main effect of a single process parameter. Whereas performing an OFAT for 5 factors requires at least 15 runs and yields only a power of 28% to detect the main effect of one process parameter.
In current industry practice, power estimation is mostly done using a signal to noise ratio of 2 or 3 for all responses. By this, we assume that for all investigated responses only effects that are twice or three-times as big as the standard deviation of the model residuals are of interest. In reality, however, relevance is determined by the target ranges or intermediate acceptance criteria (IACs) of the process. Those ranges reflect thresholds for CQAs at intermediate process steps that need to be met in order to have a high chance to reach drug substance specifications at the end of the manufacturing process. Whenever varying PPS, all CQAs and KPIs should stay within their IACs. This area of process parameter change is called the design space. Therefore, it is sensible to define relevant effects as effects for which one or more CQAs start to exceed their target ranges, when varying PPs within the design space. This would result in specific signal to noise ratios for each response. In this case, the response with the smallest signal to noise ratio would determine the sample size, that is the number of required runs which are necessary for adequate power.
In addition, authorities more and more request power estimations that are based on true data rather than making universal assumptions. To comply to this request, data from early development or historical data can be used to estimate the relevant effect sizes and the expected variances or responses.
Since critical effects are often unknown during design creation it is recommended to perform a retrospective power analysis after the data analysis step. This helps to not overlook critical effects.
Success factor: Investigate the impact of a maximum number of PPs onto CQAs with maximal power and minimal experimental effort
6 The Right Control Strategy for Individual Unit Operations
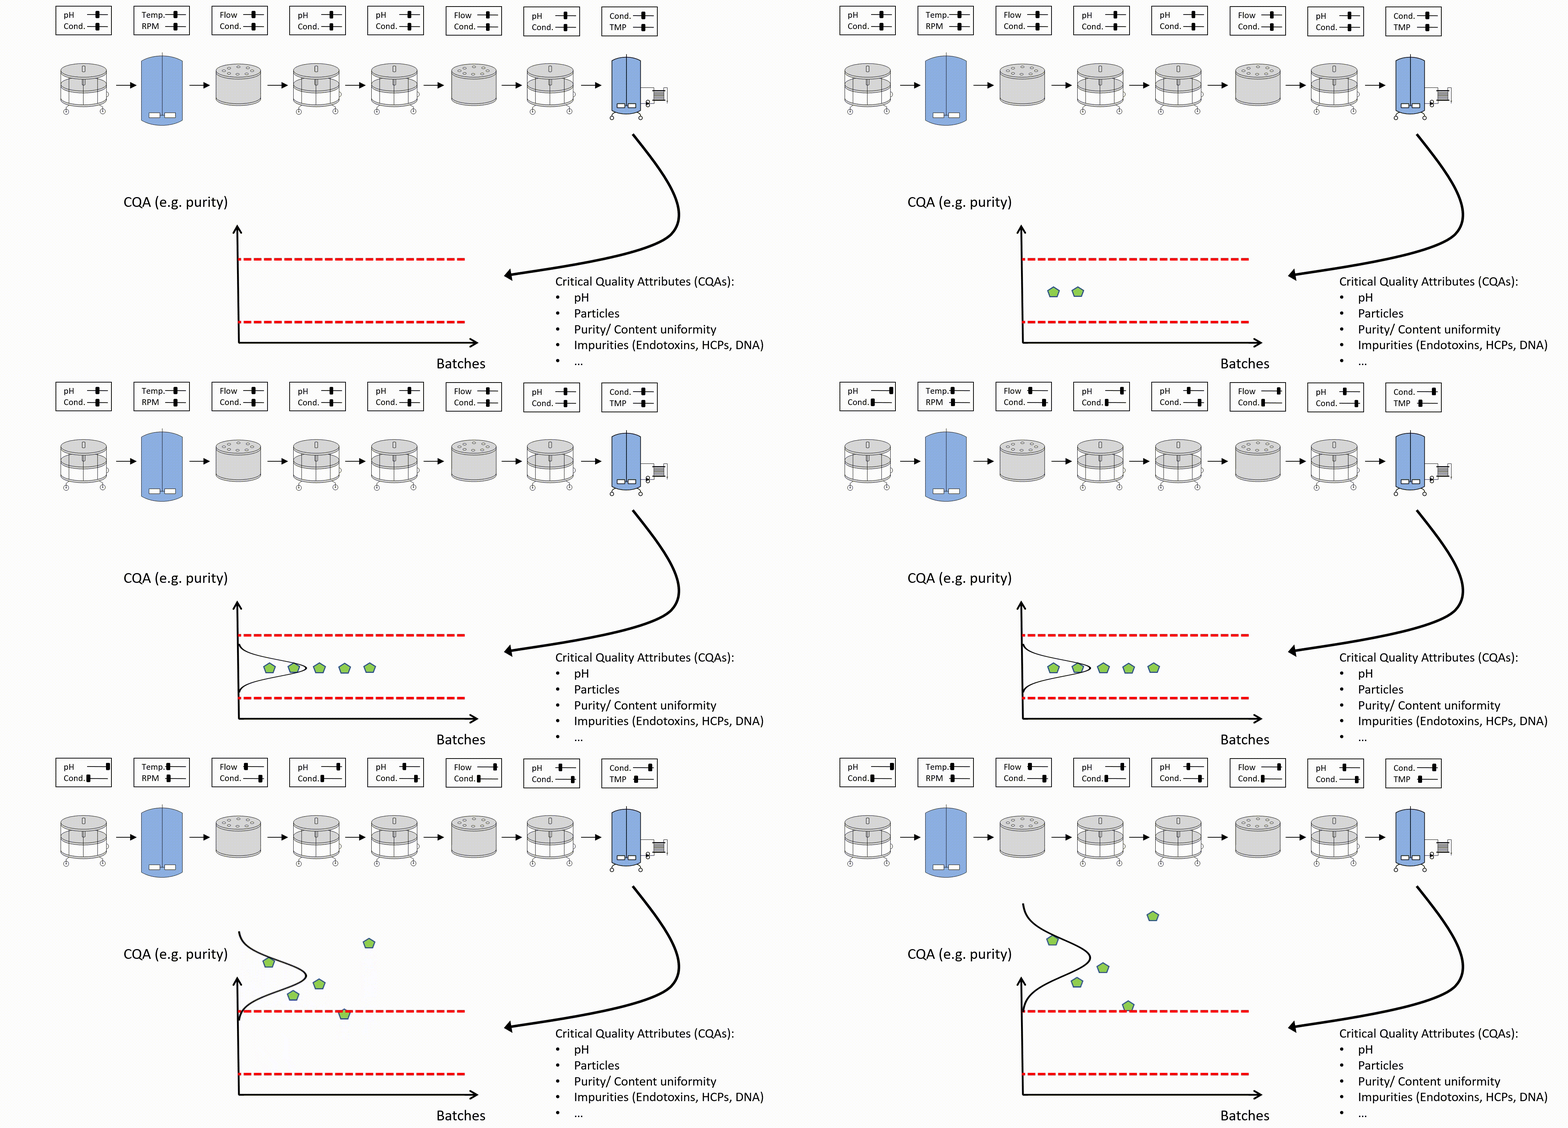
The final goal of a PCS study is setting the control strategy, either for each unit operation separately or in a holistic fashion. This can be illustrated by a chain of workers in a manufacturing process. Mistakes of one worker might be compensated by the other workers. An individual control strategy for each worker would not accurately control for the overall failure rate. It’s basically the same with a chain of unit operations that could contribute to the clearance of impurities. State of the art procedures might set a much too conservative control strategy as they use established models for individual unit operations since mutual clearance of unit operations is disregarded.

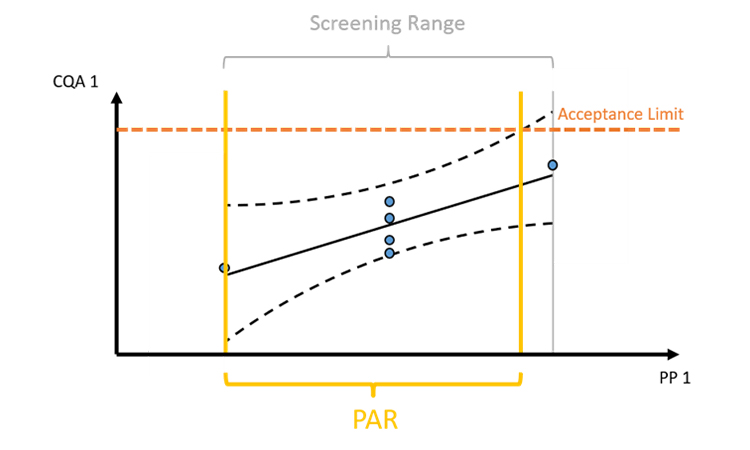
Figure 2: The intersection of intermediate acceptance limits and prediction/tolerance intervals of model predictions define the control range, e.g. the proven acceptable range (PAR). However, intermediate acceptance at any intermediate unit operation is difficult to establish.
As shown in Figure 2, prediction/tolerance intervals of model predictions are intersected with intermediate acceptance criteria. Usage of confidence intervals, that reflect the uncertainty around the mean of the regression prediction, are statistically not recommended to be used for deriving control strategies. This is due to the fact that we want to define control strategies that ensure that a large fraction (e.g. 95%) of the future runs will be within the IACs not only the mean of the future runs. A second issue, as addressed above, is that IACs are very difficult to infer from data. Therefore, setting of a holistic control strategy that ensures meeting drug substance criteria by taking the mutual interaction of all unit operations into account is preferred.
Success factor: Scientific sound definition of a control strategy of individual unit operations ensures performance and quality achieved at intermediate steps. However, a holistic control strategy is recommended as described in step 7.
7 Establish a Holistic Control Strategy
Setting the control strategy based on the patients’ needs requires meeting overall drug substance specifications. For that, the knowledge of how single PPs impact on CQAs in drug substance, is crucial and can be established using integrated process models (IPMs). These model form a framework that incorporates models from individual unit operations, which might be statistical or mechanistic models. The framework concatenates those models by propagating the output of one model to the next. Thereby estimations on the final product quality in terms of analytical quality attribute measurements at drug product level can be achieved. Even further, clinical studies can be seen as an additional “process step” with the readout of patient safety and efficacy. Assuming uncorrelated and practical relevant variance of quality attributes at drug product level, addition of clinical studies to the IPM is possible and would directly enable to set control strategies for the manufacturing process based on patient safety and efficacy. Read more on that here.

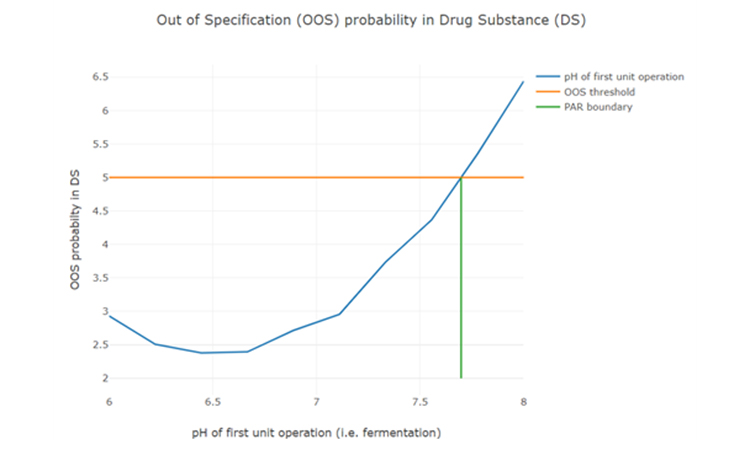
After setting up an integrated process model, out of specification (OOS) chances can be estimated as a function of PPs of any unit operation (see Figure 3). To determine the control limits for any PP at any intermediate unit operation, a risk based decision criteria (e.g. a change to 5% OOS) can be applied. For example:

Figure 3: Parameter sensitivity analysis of one intermediate process parameter onto final drug substance out of specification probability.
That holistic approach (taking into account mutual beneficial interaction of multiple unit operations) has the desired result that the control strategy stays rigid where this is required to reach drug substance specifications, but is as wide as possible to obtain manufacturing flexibility.
Success factor: Capturing the mutual interplay of multiple unit operations and predicting impact of PPs at any intermediate unit operation on DS product quality. This allows for assessment of a holistic criticality of PPs and increases operational flexibility.
8 Conclusions
To reduce time-to-market of any biopharmaceutical product, a successful PCS is pivotal. Here we presented a unique workflow:
- A process validation master plan (to ensure scope, deliverables and timelines are aligned between all stakeholders).
- Statistical occurrence analysis and new risk rating scales (to reduce subjectivity during risk assessments)
- Innovative visualization techniques (to guarantee fast and precise identification of critical unit operations to reach QTPP)
- Statistical equivalence testing (to make sure practically relevant differences between scales are not overlooked).
- Cutting edge optimal experimental designs (to identify main and interaction effects of PPs onto CQAs with a minimum number of experiments)
- Model based definition of control strategy for each individual unit operation
- A holistic definition of a control strategy using integrated process modelling, as only that ensures drug substance specifications are met and thereby ensuring patients’ safety.
At the heart of every PCS work is planning, analyzing and executing necessary experiments . Statistical tools (e.g. data assisted risk assessment, DoE planning, integrated process modelling) help facilitate this work. They also ensure the right focus & reduction of experimental effort, setting of feasible control strategies for manufacturers and finally timely market entry.1, 2, 3, 4
iSpeak Blog posts provide an opportunity for the dissemination of ideas and opinions on topics impacting the pharmaceutical industry. Ideas and opinions expressed in iSpeak Blog posts are those of the author(s) and publication thereof does not imply endorsement by ISPE.


