Effect of Gum on in Vitro Dissolution of Powder for Oral Suspension

Powder for oral suspension (PfOS) bioavailability is mostly on the basis of drug absorption from the gastrointestinal tract. PfOS formulation pH, viscosity, vehicle buffer capacity, drug particle size distribution, density, and viscosity are often critical for absorption. Therefore, careful design and selection of excipients—including suspending agents—are necessary during PfOS formulation development. This article describes experiments that were conducted to determine whether gum concentration should be considered a key attribute in PfOS formulation development.
Dry powder for reconstitution to suspension is a preferred formulation for certain populations, such as pediatric1 and geriatric2 patients. Oral suspensions are commonly prescribed for patients in these age groups if they cannot swallow tablets or capsules. Because the formulation attributes affect absorption, excipients must be carefully selected and designed. In PfOS formulations specifically, many key formulation attributes—suspendability, potential for reconstitution inaccuracies, solubility, etc.—must be addressed during development to provide optimal biopharmaceutical performance. The experiments described here explored the benefit of using gum as an effective release modifier as well as examined gum’s functional property as a suspending agent. The studies were done on various PfOS prototype formulas, with an active content of 200 mg/mL, to expand on the body of knowledge for robust PfOS formulation development.
Materials and Methods
In the experiments, the suspending agent used in the formulations was the polysaccharide xanthan gum, a type of sugar made by the bacterium Xan-thomonas campestris through a process of fermentation.3. The other excipients used in the formulation were selected based on those used in the Reference Listed Drug (RLD) and excipient compatibility studies on the active pharmaceutical ingredient (API).
An increase in the concentration of the suspending agent in the formula composition may lead to the formation of lumps in the reconstituted suspension, whereas a decrease in the concentration of xanthan gum may lead to a faster dissolution profile. Three batches were manufactured, each with a varying concentration of xanthan gum, for two different drug substance sources (six batches total). The assay, related substances, pH, and water content by Karl Fischer titration results were found to be acceptable. The xanthan gum functionality was verified with the observed rate of sedimentation in all six experimental batches.
The drug substance is a Biopharmaceutics Classification System (BCS) class II compound displaying low aqueous solubility across the physiological pH range, where dissolution in the stomach and absorption in the upper small intestine are expected. Because the drug substance is a BCS class II compound, particle size distribution of the drug substance may effect dissolution.4 The experiment considered two sources (and batches) where the sol-id-state form of the drug substance batches did not have any impact on the dissolution of the drug product. The same processing parameters were applied for manufacturing all experimental batches.
The API exhibits pH-dependent solubility across a pH range of 1.2–7.2, and pH 4.5 dissolution media was selected for the analysis. The pH in a fasted state of the stomach is 4.5, 5 and pH 4.5 acetate buffer media therefore has the benefit of serving as an effective biorelevant media with larger dis-criminative power. Another advantage of this preparation is that it is does not require the complex processes necessary to prepare samples using simulated gastric fluid.
To compare the dissolution profiles, we used a model-independent mathematical approach using a similarity factor (f2) to measure the closeness between two profiles.6, 7 The equation is as follows:
f2=50log{[1+1nn∑n−1(Rt−Tt)2]−0.5∗100}
where n is the number of observations, Rt is the average percentage of drug dissolved from the reference formulation, and Tt is the average percentage of drug dissolved from the test formulation.
When two profiles are identical, f2 equals 100. An average difference of 10% at all measured time points results in an f2 value
of 50.8
Results
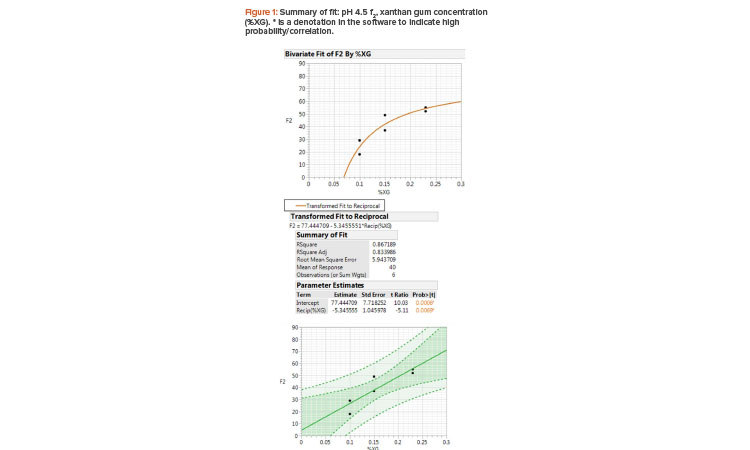
The f2 results of pH 4.5 acetate buffer and xanthan gum concentration fit a reciprocal model where the slope is a function of 1/X (Figure 1). The R-squared value is 0.867, where 86% of the variation in the y axis (f2 value) is explained by the x axis (xanthan gum concentration) and the root mean square error is 5.9, implying a good reciprocal model fit to the two variables. The f2 value was considered the primary criteria here because the higher the f2 value is, the closer the drug product formulation is to the desired RLD in vitro dissolution behavior. The t ratio and p value (prob>|t|) indicate that the slope is significant at the 0.05 level. The dark-shade region indicates a 95% confidence level and the light-shade region indicates a 95% prediction interval at any given point.
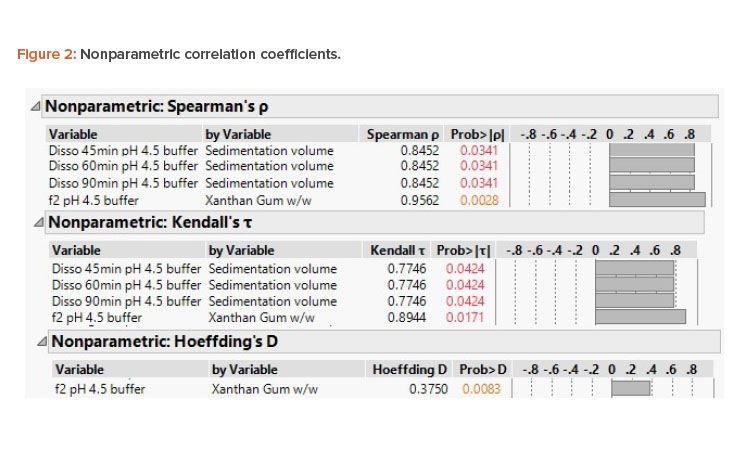
The assessment with f2 is expected to be linear; however, it must be noted that f2 is bound (i.e., it cannot be less than 0 and cannot be greater than 100). Although the sample sizes are low, the nonparametric correlation coefficients deduced (Figure 2) indicate a positive correlation of sedimentation volume and xanthan gum concentration percentage to pH 4.5 acetate buffer dissolution.
Empirical studies on biorelevant media are warranted when selecting gum as a suspending agent for PfOS formulations.
It is noteworthy that a previous study compared generic drug products and RLD tablet dissolution profiles and concluded that important differences exist among the different generics in the market with regard to their in vitro performance in pH 4.5 acetate buffer; therefore, the authors recommended clinical safety evaluations prior to switching patients from one generic to another.9 Analysis of the results of our formulation development experiments (Table 1) suggests that formulators should be cautious about gum concentration. The pH 4.5 acetate buffer media dissolution profiles are useful predictors of clinical differences among formulations.10


| Test | RLD | Batch 1 (API 1) |
Batch 2 (API 1) |
Batch 3 (API 1) |
Batch 4 (API 2) |
Batch 5 (API 2) |
Batch 6 (API 2) |
|---|---|---|---|---|---|---|---|
| Xanthan gum (% w/w) | N/A | 0.1 | 0.15 | 0.23 | 0.15 | 0.1 | 0.23 |
| Water content by Karl Fischer KF titration (% w/w) | N/A | 0.89 | 1.4 | 0.88 | 0.8 | 0.8 | 0.84 |
| pH of suspension | N/A | 6.52 | 6.6 | 6.57 | 6.76 | 6.71 | 6.55 |
| RLD | Batch 1 (API 1) |
Batch 2 (API 1) |
Batch 3 (API 1) |
Batch 4 (API 2) |
Batch 5 (API 2) |
Batch 6 (API 2) |
|
|---|---|---|---|---|---|---|---|
| API | N/A | 98.1 | 98.8 | 97.4 | 100.2 | 97.5 | 102.2 |
| Methyl paraben | N/A | 96.1 | 101.7 | 101.7 | 97.4 | 92.3 | 101.4 |
| Total impurities | N/A | 0.411 | 0.374 | 0.364 | 0.353 | 0.299 | 0.244 |
| Time | RLD | Batch 1 (API 1) |
Batch 2 (API 1) |
Batch 3 (API 1) |
Batch 4 (API 2) |
Batch 5 (API 2) |
Batch 6 (API 2) |
|---|---|---|---|---|---|---|---|
| 10 minutes | 30 | 60 | 40 | 60 | 60 | 30 | 60 |
| 30 minutes | 30 | 59 | 40 | 60 | 60 | 30 | 60 |
| 60 minutes | >29 | 59 | 40 | 60 | 60 | 29 | 60 |
| 8 hours | 29 | 59 | 39 | 60 | 59 | >28 | 60 |
| 2 days | 28 | 59 | 39 | > 59 | 58 | >28 | > 59 |
| 4 days | >27 | 59 | 39 | 59 | 58 | >28 | 59 |
| 2 weeks | 26 | 59 | 39 | 59 | 58 | >28 | 59 |
| 4 weeks | 26 | 59 | 39 | 59 | 58 | >28 | 59 |
| 45 days | 26 | 59 | 39 | 59 | 58 | 28 | 59 |
| 60 days | >25 | 59 | 39 | 59 | 58 | 28 | 59 |
| Sedimentation volume | 0.86 | 0.98 | 0.98 | 0.98 | 0.97 | 0.93 | 0.98 |
| Test (min) | RLD | Batch 1 (API 1) |
Batch 2 (API 1) |
Batch 3 (API 1) |
Batch 4 (API 2) |
Batch 5 (API 2) |
Batch 6 (API 2) |
|---|---|---|---|---|---|---|---|
| 0 | 0 | 0 | 0 | 0 | 0 | 0 | 0 |
| 5 | 24 | 67 | 33 | 19 | 41 | 14 | 22 |
| 10 | 37 | 82 | 52 | 34 | 51 | 21 | 37 |
| 15 | 48 | 90 | 66 | 47 | 58 | 26 | 49 |
| 20 | 54 | 93 | 75 | 58 | 63 | 31 | 57 |
| 30 | 63 | 96 | 86 | 72 | 69 | 35 | 69 |
| 45 | 69 | 99 | 91 | 83 | 75 | 39 | 79 |
| 60 | 72 | 100 | 92 | 87 | 79 | 42 | 84 |
| 90 | 77 | 102 | 95 | 90 | 85 | 45 | 91 |
| 120 | 82 | NP | NP | 93 | 89 | 48 | 95 |
| Infinity | 89 | 106 | 97 | 94 | 90 | 63 | 96 |
| f2 value | N/A | 18 | 37 | 52 | 49 | 29 | 55 |
Note: N/A = not available.
Conclusion
The experiments validate the hypothesis that the concentration of the suspending agent affects dissolution performance. The statistical data analysis of the experimental batches projects that the concentration of xanthan gum has an effect on the dissolution profile of the drug product released in bio-relevant pH 4.5 acetate buffer dissolution media.
Empirical studies on biorelevant media are warranted when selecting gum as a suspending agent for PfOS formulations. The findings of the study may encourage use of gum as an effective release modifier and improve understanding of its functional properties more than being a suspending agent.


